
The Coral X-radiograph Densitometry System (CoralXDS) is a Windows-based program which provides a tool for measurement of linear extension, density, and calcification from coral X-radiographs. These quantities are determined for high-density, low-density, and annual bands. CoralXDS operates in two "modes": full mode and extension/luminance mode. Full mode measures linear extension, density, and calcification, while extension/luminance mode measures only linear extension. Extension/luminance mode requires only a coral image with scaling information. CoralXDS allows user specification of transect location and orientation on the coral image, and provides several options for automated and manual band selection. The output measurements are provided as plots and datasets.
When two materials (e.g., coral sample and aluminum standard) are X-rayed (Figure 1) and the exposed film exhibits equal optic density for both materials,
the density of the sample material can be calculated (Buddemeier, 1974; Chalker et
al., 1985) from:
(Figure 1) and the exposed film exhibits equal optic density for both materials,
the density of the sample material can be calculated (Buddemeier, 1974; Chalker et
al., 1985) from:
(tm)s · rhos · etas = (tm)st · rhost · etast (1)
- (tm)st = mass absorption coefficient of standard
- (tm)s = mass absorption coefficient of sample
- rhost = density of standard
- rhos = density of sample
- etast = thickness of standard
- etas = thickness of sample
Solving for density of the sample:
- rhos = ((tm)st / (tm)s) · (etast / etas) · rhost (2)
Hence, one can find density of the specimen from film transparency if one knows:
- the thickness of the standard (etast) and the thickness of the sample (etas).
- the density of the standard (rhost).
- the mass absorption coefficient ratio of standard to sample ((tm)st / (tm)s)
Buddemeier (1974) obtained the mass absorption coefficients from tabulated values, but the method required the exact determination of the energy of the X-ray beam (continuous converted to single), voltage of machine, and composition of material. Chalker et al. (1985) avoided such problems by using relative mass absorption coefficients. They determined the relative mass absorption coefficient of the standard and sample by slopes of curves fitted to data of sample thickness versus densitometer output voltage.


CoralXDS employs a modification of the Buddemeier and the Chalker et al. methods. Digitized X-radiographs and computerized image processing are used instead of densitometer voltages. Instead of a step wedge or tubes of material, triangular wedges of known dimensions and density (aluminum and aragonite) are used to obtain a relationship between optic density and thickness. Absolute values for the mass absorption coefficients are not needed because the relative mass absorption coefficient ratio is determined by curve fitting. Since ((tm)st / (tm)s) is a constant ratio the term tmr can be substituted:
- rhos = tmr · rhost · (etast / etas) (3)
The tmr for the aluminum (Al) and aragonite (Ar) wedges is determined by plotting relative optic density versus rho · eta. The value of tmr that minimizes the sum of the residuals |tmr Al - Ar| is determined. Figure 2 shows the offset for the unadjusted aluminum and aragonite data. Figure 3 shows the data fit with a tmr of 0.642.

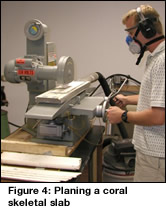
Coral samples are commonly collected by coring. A core is medially sectioned producing slabs approximately 5 to 10 mm thick. The slab is planed with a precision surface grinder to ensure the slab is parallel sided of uniform thickness (Figure 4).
 The coral slab and the aluminum wedge are placed on a sheet of 8" x 10" X-ray film.
The film is placed on a lead vinyl sheet and aluminum plate. The film is X-rayed at
50 KvP and 10 mA with a source to object distance of 1.25 m for 5 to 15 seconds based
on slab thickness and density. Another film is then placed in the same position and
covered with an aluminum sheet of thickness equal to the coral slab and X-rayed at
the same settings for use as a background image.
The coral slab and the aluminum wedge are placed on a sheet of 8" x 10" X-ray film.
The film is placed on a lead vinyl sheet and aluminum plate. The film is X-rayed at
50 KvP and 10 mA with a source to object distance of 1.25 m for 5 to 15 seconds based
on slab thickness and density. Another film is then placed in the same position and
covered with an aluminum sheet of thickness equal to the coral slab and X-rayed at
the same settings for use as a background image.

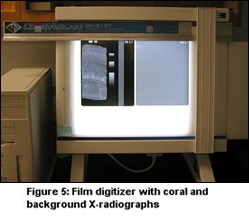
The resulting X-radiographs of the coral sample and the background are digitized using a medical X-ray scanner (Figure 5). At the same setting, a transparent ruler is digitized in a vertical and horizontal position for use in the scale calibration.
CoralXDS is a Windows-based program used for densitometric analyses on X-radiographs of coral
slabs. The required inputs are dimensions and density of the aluminum wedge, thickness
of the coral slab, the relative mass absorption coefficient ratio, and images of the
coral X-radiograph, background X-radiograph, and scale bar/ruler (Figure 6).
CoralXDS can also be used in extension/luminance mode, which is a less complicated application than the full extension, density, and calcification mode. This mode allows the rapid calculation of linear extension for annual and sub-annual coral growth bands. The required inputs for the use of CoralXDS in extension/luminance mode are an image of the coral X-radiograph, and knowledge of the scaling parameter (pixels per centimeter) used for the image.
To determine the relationship between relative optic density (ROD) and skeletal density rhos, a transect is selected along the wedge. Transect pixel luminances are converted to optic density using:
- ROD = log10(background luminance / sample luminance) (4)
 ROD values are averaged perpendicular to the wedge transect axis to give ROD as a
function of distance along the wedge, or equivalently, as a function of wedge thickness.
Using equation (3), rhos is determined as a function of wedge thickness etast since tmr , etas , and etast are constant. This provides data pairs of ROD and rhos. Two 4th order curves are fit through the data pairs (Figure 7) yielding continuous
calibration curves of ROD vs. rhos.
ROD values are averaged perpendicular to the wedge transect axis to give ROD as a
function of distance along the wedge, or equivalently, as a function of wedge thickness.
Using equation (3), rhos is determined as a function of wedge thickness etast since tmr , etas , and etast are constant. This provides data pairs of ROD and rhos. Two 4th order curves are fit through the data pairs (Figure 7) yielding continuous
calibration curves of ROD vs. rhos.
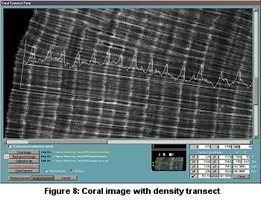
 A rectangular transect is selected on the coral image. Using the previously derived
calibration curve, the pixels within the transect are converted into skeletal density
values and then averaged over the width of the transect. Skeletal density is plotted
as a function of distance along the coral transect as shown in Figure 8.
A rectangular transect is selected on the coral image. Using the previously derived
calibration curve, the pixels within the transect are converted into skeletal density
values and then averaged over the width of the transect. Skeletal density is plotted
as a function of distance along the coral transect as shown in Figure 8.
 Using transect density data, high-density (HD) and low-density (LD) bands are determined
by three methods: Half Range (HR), 2nd Derivative Zero (2DZ), and 2nd Derivative Maximum
(2DM). Once HD and LD band portions are delimited, extension can be defined and calcification
calculated. Annual bands are defined by a pair of adjacent HD/LD bands and also by
peak to peak and valley to valley density (PV) values. Figure 9 shows examples of
the delimiting methods.
Using transect density data, high-density (HD) and low-density (LD) bands are determined
by three methods: Half Range (HR), 2nd Derivative Zero (2DZ), and 2nd Derivative Maximum
(2DM). Once HD and LD band portions are delimited, extension can be defined and calcification
calculated. Annual bands are defined by a pair of adjacent HD/LD bands and also by
peak to peak and valley to valley density (PV) values. Figure 9 shows examples of
the delimiting methods.
![]()
![]() The HR method delimits bands based on the mean of adjacent density maxima and minima.
The 2DZ method delimits bands by the inflection point between density maxima and minima.
The 2DM method delimits bands based on 2nd derivative maxima bounding a density maximum.
The HR method delimits bands based on the mean of adjacent density maxima and minima.
The 2DZ method delimits bands by the inflection point between density maxima and minima.
The 2DM method delimits bands based on 2nd derivative maxima bounding a density maximum.
Figure 10 illustrates the 2DZ delimiting method. A cubic spline curve is calculated
for the skeletal density data. The 1st and 2nd derivatives are calculated. Zero crossings
of the 2nd derivative associated with a density maximum are used to delimit the HD
and LD bands. This provides an objective means of band determination.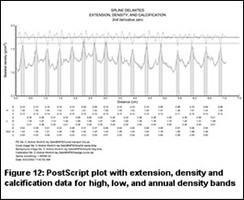
Figures 11 and 12 show examples of the output data for extension, density, and calcification for high-density, low-density, and annual bands.


Radiographic image quality is subject to variations in beam intensity including backscatter, edge-effects/magnification, the inverse square law, and the anode heel effect (Carlton and Adler, 1996). Backscatter is minimized by placing the film on a 1 mm equivalent lead vinyl sheet. Edge-effects depend on the source to object distance (SOD), source to image receptor distance (SID), and location relative to the central ray. Edge-effects at the furthest point from the central ray (6.4cm) on a typical 8" x 10" film for a 0.5-cm-thick object is 0.026 cm. Image magnification under the central ray at a SID of 125 cm is about 0.4%. Neither backscatter nor edge-effects/magnification impart a significant effect for the described system.
The inverse square law states that intensity at a given distance from a point source is inversely proportional to the square of the distance. Thus intensity decreases by this relationship moving away from the central ray.
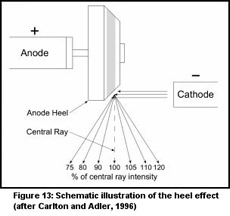
 The heel effect is produced by the geometry of an angled anode target where photons
hitting the target toward the anode end (the heel) tend to be more absorbed by the
target (Figure 13). This can result in significant variation in beam intensity along
the anode-cathode axis. The use of an X-ray background image minimizes the impact
of the inverse square law and the heel effect on the derived skeletal density of the
coral.
The heel effect is produced by the geometry of an angled anode target where photons
hitting the target toward the anode end (the heel) tend to be more absorbed by the
target (Figure 13). This can result in significant variation in beam intensity along
the anode-cathode axis. The use of an X-ray background image minimizes the impact
of the inverse square law and the heel effect on the derived skeletal density of the
coral.
Errors associated with program methodology are sample thickness and wedge calibration.
To investigate the errors in skeletal density calculation due to variations in sample thickness, let:
- rhos' = calculated sample density
- eps = sample thickness error
- deltarho = error in density calculation
Using equation (3),
- rhos' = tmr · rhost · etast/(etas + eps) (5)
- deltarho = |rhos - rhos'| = tmr · rhost · etast · eps/(etas · (etas + eps)) (6)
For a 0.5 cm slab with a thickness error of 0.001 cm (tolerance of the surface grinder), the density error is 0.004 g/cm3 or about 0.2%.
By incorrectly specifying the thick edge of the wedge during calibration, an error in actual standard thickness etast at all points along the wedge is induced, thereby producing an error in sample density rhos. To determine the magnitude of this error in sample density, let:
- tmr = relative mass absorption coefficient ratio
- rhost = density of standard
- rhos = density of sample
- rhos' = calculated sample density
- etas = thickness of the sample
- H = height of the wedge at the thick edge
- L = length of wedge
- eps = error in the specification of the wedge edge
- etast(x)= thickness of wedge at a distance x from the thick edge of the wedge
etast(x) is given by
- etast(x) = H · (1 - x/L) (7)
Equation (7) illustrates the linear relationship between thickness of the wedge and distance along the wedge.
When the edge of the wedge is incorrectly specified by a distance eps, the actual and measured sample densities (at an arbitrary position x0) are given by:
- rhos = tmr · rhost · etast(x0)/etas
- rhos' = tmr · rhost · etast(x0')/ etas (8)
where x0' = x0 + eps
The density error associated with an error in the determination of the wedge edge during calibration is given by:
- deltarho = |rhos - rhos'| = tmr · rhost/etas · |etast(x0) - etast(x0')| = tmr · rhost/etas · (H · eps)/L (9)
For a single pixel offset in calibration, the density error is 0.006 g/cm3 or about 0.3%.
Discussion
Coral skeletal growth is comprised of linear extension, density, and calcification. Each parameter carries independent information and all are needed for a complete assessment of coral growth. CoralXDS produces a visual representation of a transect on a coral X-radiograph, along with a corresponding density plot, and generates graphical representations of transect growth parameters for high-density, low-density, and annual bands. Associated datasets are produced in spreadsheet-compatible form.
Advantages of CoralXDS include utilizing a smooth wedge for luminance-to-density calibration, which offers a continuous profile of density values over the wedge thickness range. The use of an X-ray background image minimizes systematic anomalies in exposure and image capture. The interface for wedge calibration and coral transect selection allows for flexible, interactive specification of band minima and maxima using several objective criteria.
The measurement of extension, density, and calcification gives a more thorough representation of variations in coral growth. CoralXDS affords a rapid and efficient method for obtaining these parameters with a high degree of accuracy.
Coral growth rates, based on annual density bands, serve as an indicator for environmental change as well as a template for isotopic and elemental analysis of the skeleton. Growth rates are also useful for testing hypotheses regarding variations in growth attributable to climatic changes such as rising carbon-dioxide levels and sea-surface temperature. Additionally, coral growth can be analyzed for spatial variations such as depth dependence and latitudinal effects as well as temporal variations such as El Niño events.
References
-
Helmle, K.P., K.E. Kohler, and R.E. Dodge (2002) "Relative Optical Densitometry and The Coral X-radiograph Densitometry System: CoralXDS" Presented Poster (omitted from abstract book, but included in program), Int. Soc. Reef Studies 2002 European Meeting. Cambridge, England. Sept. 4-7.
-
Buddemeier, R.W.1974. Environmental controls over annual and lunar monthly cycles in hermatypic coral calcification. Proc. 2nd Int. Coral Reef Symp. 2:259-267.
-
Carlton, R.R., and A.M. Adler 1996. Principles of Radiographic Imaging. Delmar Pub., Albany, NY, 2nd ed., 730 pp.
-
Chalker, B., Z. Barnes, and P. Isdale.1985. Calibration of x-ray densitometry for the measurement of coral skeletal density. Coral Reefs 4:95-100.