Habitat Equivalency Analysis Software to Facilitate Calculation of Compensatory Restoration following Natural Resource Injury
The lost services are calculated from the time of injury through the recovery process. Recovery could be either via natural recovery or active restoration. The compensatory restoration services are calculated from the time of commencement through process of the chosen restoration. An injury to natural resources therefore involves a time component during which the ecological services that the resources provide are lost and over which the services of any compensatory restoration are gained. HEA uses a discounting procedure to account for asset valuation in that the total asset value is equal to the present discounted value of the future stream of all services from the natural resource or the compensatory resource. This concept of discounting is explained by an individual's preference for goods and services at any given time. Discounting takes into account that the further into the future that a service is provided, the less it is valued today. Therefore, the HEA approach is particularly well suited for analysis because it can be used to quantify the loss and recovery of resources and includes this time factor.
Visual_HEA is a program that provides an efficient method of calculating the required compensation. The program accepts input of parameters necessary to determine long-term service loss from the injury (injured area size and degree; times of injury, functional shape, and equilibrium; post-injury recovery); parameters to determine long-term service gain from compensatory restoration actions (times of restoration beginning and equilibrium; maximum service level; service gain function shape); and general program parameters (relative value of lost and gained services, baseline level of lost and gained services, discount rate).
Because HEA results are highly dependent upon assumptions, it is useful to examine sensitivity of results using a range of parameter values. Visual_HEA facilitates comparisons by offering an intuitive graphical interface that allows the user to modify input parameters and quickly alter the lost and gain service level shape functions. The ability to formulate many scenarios provides an efficient method of gauging the sensitivity of the required compensatory action scale to the analysis parameterization and time variability.
We have developed an interactive program, Visual_HEA, that facilitates input of HEA assumptions and parameters and provides an efficient method of calculating the required compensatory action. The program allows input of the relevant parameters necessary for analysis:
Service loss parameters:
- Injury area size
- Time history of service levels at the injury site
Service gain parameters:
- Time history of service levels at the restoration site
General program parameters:
- Relative value of lost and gained services
- Baseline level of lost and gained services
- Discount rate
Because HEA results are highly dependent upon assumptions, it is useful to examine sensitivity of results using a range of parameter values. Visual_HEA facilitates this by offering an intuitive graphical interface that allows the user to modify input parameters and quickly alter the recovery shape functions. The ability to formulate many "what-if" scenarios provides an efficient method of gauging the sensitivity of the required compensatory action scale to the analysis parameterization and time variability.
Below are the formulae used to calculate the required compensatory action (from NOAA, 2000).
Time Parameters
t=0, time when the injury occurs
t=B, time when the injured habitat recovers to baseline
t=C, time when claim is presented
t=I, time when the habitat project beings to provide services
t=M, time when the habitat replacement project reaches full maturity
t=L, time when the habitat replacement project stops yielding services
Other Variables
Vj, value per area-time of services provided by injured habitat
Vp, value per area-time of services provided by replacement habitat
xtp, level of services provided by replacement habitat at end of time t
bp, initial level of services per area of replacement habitat
pt, discount factor where pt=1/(1+r)(t-C), r is discount rate
J, number of injured area units
P, size of replacement project
Calculated Quantities
(bj-xtj) extent of injury at time t
(xtp-bp) increment in services provided by replacement project
(bj-xtj)/bj percent reduction in services per area for injured area
(xtp-bp)/bj percent increase in services per area for replacement area
The goal of habitat equivalency analysis is to solve for the size of the replacement project P. To accomplish this, the sum of the present discounted value of services lost as a result of the injury is set equal to the present discounted values of the services provided by the replacement project:
Mathematical equation with summation notation

HEA Approach for Calculating Broward County Nearshore Mitigation Amount
This case study illustrates a plan for the renourishment of beaches in Broward County, Florida, which involved the covering of 10.1 acres of hardground coral reef community habitat with sand. Local government proposed to provide mitigation in the form of limestone boulders in order to compensate for the loss of the 10.1 nearshore acres. In order to complete the HEA, reasonable assumptions were made about the relative recovery rates of the hardground acres and the mitigation area, the discount rate, and the start times and amounts of lost and full services of the injury and mitigation.
The nearshore injury was assumed to begin in 2003 and the mitigation to also begin at the same time in 2003. The discount rate was assumed to be the long-term historical average of 3%.
Other assumptions include:
Extent of injury and loss of services of hardground
- 20% lost upon inception in 2003
- 100% lost 3 years later in 2006
- 100% loss continues in perpetuity (habitat remains sand covered forever)
It was also assumed that while the mitigation boulders will recover to 100% full services in 50 years naturally, they will recover to those 100% full services in less time (15 years) by transplanting corals onto them. By transplanting corals, the mitigation boulders will begin recovery not at 0% of full services, but at some higher value. A level of 10% was agreed upon by all parties.
Services gained by the mitigation boulders
- 10% of services upon transplantation of larger corals older than 15 years onto boulders in 2003
- 100% full services reached after 15 years in 2018
- 100% full services continues in perpetuity
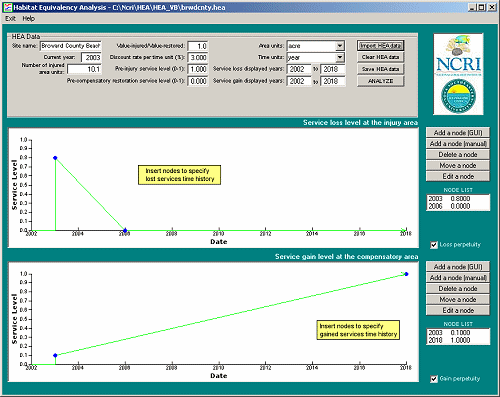
The Visual_HEA program consists of a single main form. To perform an analysis, the following initial information must be provided:
- Site name: user can specify name of analysis site, analysis, etc.
- Current year: year of analysis
- Number of injured area units: size of injury site in spatial units
- Ratio of injured/restored service values: relative value of lost versus gained services per time-area unit
- Discount rate (%) per time unit: amount of discounting to reflect the relative value of present versus future service levels
- Pre-injury service level: level of services provided by the injured area prior to injury
- Pre-compensatory restoration service level: level of services provided by the restoration area prior to restoration
- Area and time units (e.g. m2, years)
- Service loss displayed years: time span of service loss analysis to be displayed
- Service gain displayed years: time span of service gain analysis to be displayed
The recovery times and service levels for both the injured site and the replacement site must be specified by placing nodes along the time axis which represent the level of services provided at a given time. This can be done either directly through the graphical interface or manually by inserting the service level and time values into a pop-up dialog box. A linear recovery function is typically used; however alternative recovery shapes could be used as well. The ease of placing and moving the service level nodes allows many different scenarios to be analyzed in a short amount of time.
Any or all of the various scenarios can be saved for later analysis by clicking the "Save HEA data" button. When specifying the time history of the injury and restoration areas, an important factor in the HEA is whether or not the services lost or gained continue in perpetuity. This can have a very significant effect on the calculated size of the replacement site.
The following panel illustrates data input for the beach renourishment project described above:

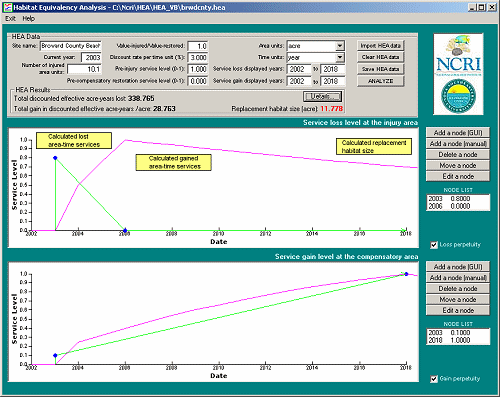
After the initial parameters and the recovery function information have been specified, the analysis can be performed by clicking "Analyze".
The following panel illustrates simplified graphical data results:

The areas under the new magenta curves represent the total levels of services lost or gained in units of effective area-time units.
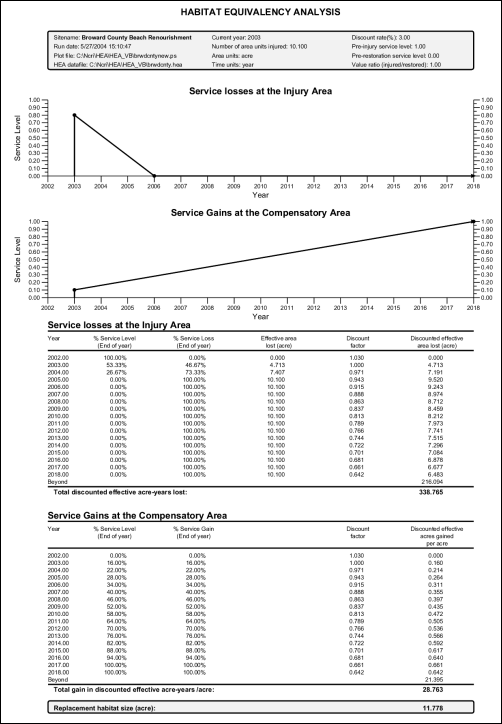
Below is a more detailed summary of the HEA results, automatically generated by the program as a PostScript file:

The analysis indicates that a replacement project of 11.8 acres will provide service gains equal to the services lost in the injured area. Note the significant contribution made by having both the services lost and services gained extend forever into the future in the lines marked "Beyond" in the table above.
Summary
We have developed an interactive program, Visual_HEA, that facilitates input of HEA assumptions and parameters and provides an efficient method of calculating the compensatory action required for a given injury site. The program allows input of the relevant parameters necessary for analysis, and through the use of an intuitive graphical interface, the input parameters and recovery shape functions can be quickly changed. The ability to formulate many "what-if" scenarios using the graphical interface provides an efficient method of gauging the sensitivity of the required compensatory action scale to the analysis parameterization and time variability.
Version 2.61
The National Coral Reef Institute released minor version 2.61 of Visual HEA in October of 2014. This version includes bug fixes to the software and reformatting of the .pdf output file. Quarterly calculations have been enhanced and improvements made to the GUI to facilitate quarterly analysis. Version 2.61 is backward-compatible with previous versions.
Version 2.6
In cooperation with the University of Montpellier, the National Coral Reef Institute has released version 2.6 of Visual HEA in August of 2012 which includes a full French translation and many enhancements and bug fixes. To comply with the Environmental Liability Law of 2006 and via the European Directive of 2008, the French government has recommended Visual HEA serve as the de facto standard software to be used when conducting habitat equivalency analysis.
Version 2.6 includes the following major enhancements and bug fixes:
- Full French translation
- Discount rate accuracy has been increased to 3 decimal places
- French version default discount rate has been set at 4% (the European standard)
- Output to a .pdf file has been added the postscript output has been discontinued
- An error in the calculation of quarterly SAY's gained has been fixed
- An error in calculating quarterly % services lost has been corrected
- A correction was made to calculate the entire last year when calculating quarterly gains
- Pre-injury and pre-service level decimal precision has been increased to 2 decimal places
- The ability to manually configure quarterly nodes has been added
Both the French and English version of Visual HEA 2.6 are available in the downloads section.
About Visual HEA
The Visual HEA program is being made available free of charge to the scientific community as copyrighted freeware and cannot be sold, modified, or re-distributed. You will be sent the download information via email after completing our Visual HEA Download Request Form.
Visual HEA is released as copyrighted freeware. It is Nova Southeastern University's National Coral Reef Institute's (NCRI) aim to provide a useful tool for researchers, coral reef managers, and individuals involved in coral reef monitoring, assessment, and restoration.
Visual_HEA Citation
Sylvain P, Johnston MW, Vaissièrec AC, Bergerd F, Jacoba C, Dodge R (2017) An update of the Visual_HEA software to improve the implementation of the Habitat Equivalency Analysis method. Ecological Engineering 105, 276-283.
- Download the paper (998KB PDF)
Kohler, K.E. and R.E. Dodge (2006) Visual_HEA: Habitat Equivalency Analysis software to calculate compensatory restoration following natural resource injury. Proceedings of the 10th International Coral Reef Symposium. Okinawa, Japan. pp. 1611-1616.
- Download the paper (626KB PDF)
References
- National Oceanic and Atmospheric Administration. 2000. Habitat Equivalency Analysis: An Overview. Washington, D.C. NOAA
- Milon, J.W. and R.E.Dodge. 2001. Applying Habitat Equivalency Analysis for Coral Reef Damage Assessment and Restoration. Bull. Mar. Sci., 69(2): 975–988.
- This work is a result of research funded by the National Oceanic and Atmospheric Administration Coastal Ocean Program under award #NA03NOS4260046 to Nova Southeastern University for the National Coral Reef Institute (NCRI).
Support Visual HEA
Due to its popularity, updating Visual HEA and providing support via email and telephone requires a significant amount of time and effort. If you have found Visual HEA to be useful for your institution's research, we encourage you to make a donation that will be used for the further development and support of Visual HEA.
You can make a donation by directly sending a check or by credit card. Please email "Visual HEA Donations" to wendyw@nova.edu for details.
Donation suggestions:
- Single user: $200
- Multiple user (<10): $500
- Multiple user (>10): $1000
